- 投稿者 : epis
- 更新日: 57分前 2 アクセス
今日は久しぶりにIELTSのライティング練習問題です。
グラフや表を見て、客観的に説明する課題です。
(エピスはバルセロナからのオンライン受講生を募集中です!)
Directions:
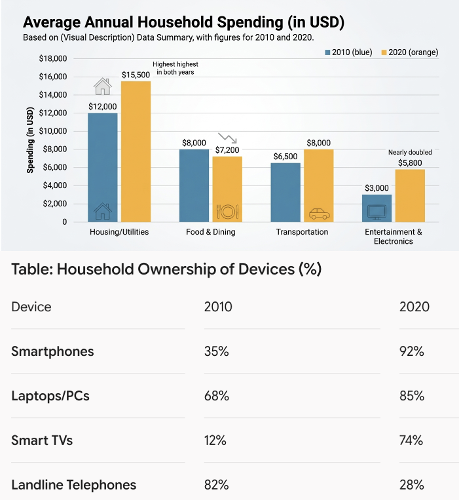
The bar chart shows the average expenditure per household on four major categories in a particular country in 2010 and 2020. The table shows the percentage of households that owned key consumer electronics in the same country over the same period.
Summarize the information by selecting and reporting the main features, and make comparisons where relevant.
Write at least 150 words.
You should spend about 20 minutes on this task.
epis Education Centreフランクフルト教室
お問い合わせはコチラからどうぞ!
↓
https://www.epis-glb.com/frankfurt/contact/
E-mail: frankfurt@epis-edu.com
TEL: +49-69-3302-0436
情報の書き込みはネチケットを守ってご利用下さい。
*個人情報を流出させたりプライバシーを侵害したりした場合、名誉毀損罪など犯罪の他民事訴訟にも訴えられる事があります。
コメント:この投稿は、コメント追加が許可されていません。